EViews 14 (Powerful Econometric and Time Series Analysis Software) Download
Summary
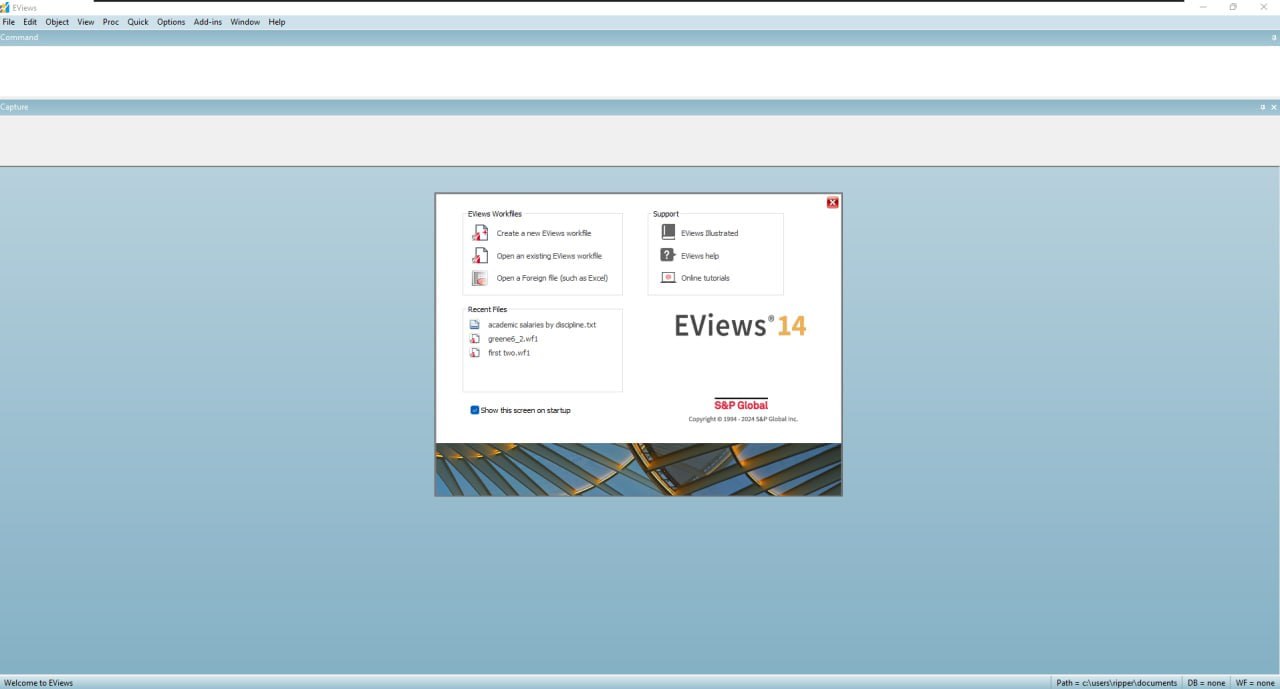
EViews is a professional Statistical and econometric Software package widely used for time series analysis, forecasting, and data modeling in research, economics, finance, and policymaking. Originally developed by Quantitative Micro Software (QMS), EViews has evolved into a leading software choice for professionals and academics who need reliable econometric tools for empirical research and forecasting tasks. It is designed to handle complex datasets and is suitable for both beginners and advanced users due to its combination of graphical user interface and powerful analytical tools. Over the years, it has been adopted by government agencies, financial institutions, and universities for its ability to handle sophisticated data analysis workflows.
The core purpose of EViews is to enable users to perform advanced statistical and econometric analyses on a wide range of data types, including time series, cross-sectional, and panel data. Its functionality extends to forecasting future trends based on historical data, conducting regression and hypothesis tests, and modeling dynamic relationships between variables. This makes it particularly valuable for economic forecasting, financial market analysis, simulation exercises, and empirical research in the social sciences. The software offers both quick results through its graphical interface and deep analytical capabilities for specialized modeling.
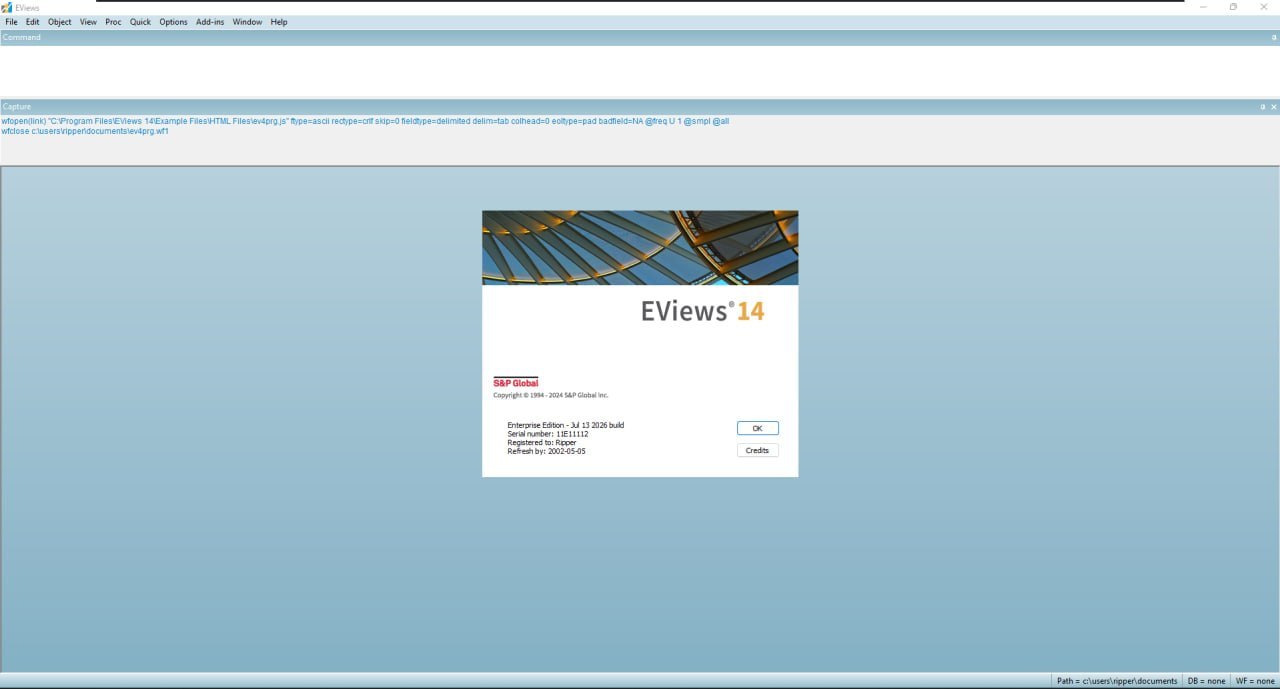
EViews Activation Proof
Time Series Handling and Data Management
EViews places strong emphasis on time series data, allowing users to work with regular and irregular frequency data, such as annual, quarterly, monthly, weekly, and high-frequency intervals. Its integrated data handling tools support a variety of operations, including seasonal adjustment, interpolation, and filtering for trend detection. Users can import data from multiple formats, such as Excel, ASCII, and other statistical packages, combining spreadsheet-like flexibility with analytical depth. This capability makes it suitable for economic time series research where understanding temporal dynamics is crucial.
Statistical and Econometric Analysis Tools
At its core, it provides a comprehensive suite of statistical and econometric tools that enable users to perform hypothesis testing, model estimation, and residual analysis with ease. These tools include regression analysis, autoregressive models, GARCH (for volatility modeling), panel data techniques, and various statistical tests like unit root and cointegration tests. In addition, the software allows users to explore causal relationships and dynamic interactions in data using advanced analytical routines. These capabilities help researchers uncover patterns, test theories, and draw meaningful conclusions from empirical data.
Forecasting and Simulation Capabilities
One of the defining strengths of this software is its forecasting and simulation tools that enable users to project future values based on established models. The software supports automatic ARIMA and ARIMAX forecasting, allowing users to leverage built-in algorithms to identify optimal model specifications and generate forecasts. Beyond ARIMA, it offers integrated tools for more complex methods such as Prophet forecasting, which is useful for series with seasonality and nonlinear trends. These forecasting tools are crucial for analysts working in economic policy, financial planning, and business strategy, where accurate trend projections are essential.
Key Features
- Advanced Forecasting: Includes modeling improvements like Bootstrap Structural VAR and MIDAS GARCH estimation.
- Testing and Diagnostics: Adds Series and Residual Outlier Detection, Boosted Hodrick-Prescott filters, and test procedures for series breaks or explosive bubbles.
- Rational Expectations Solver: New methods like Gauss-Seidel and E-Newton handle complex equations with both future and past values.
- Seamless Data Management: Direct drag-and-drop support to import and export over 20 data formats, including Excel, R, SAS, Stata, and SPSS.
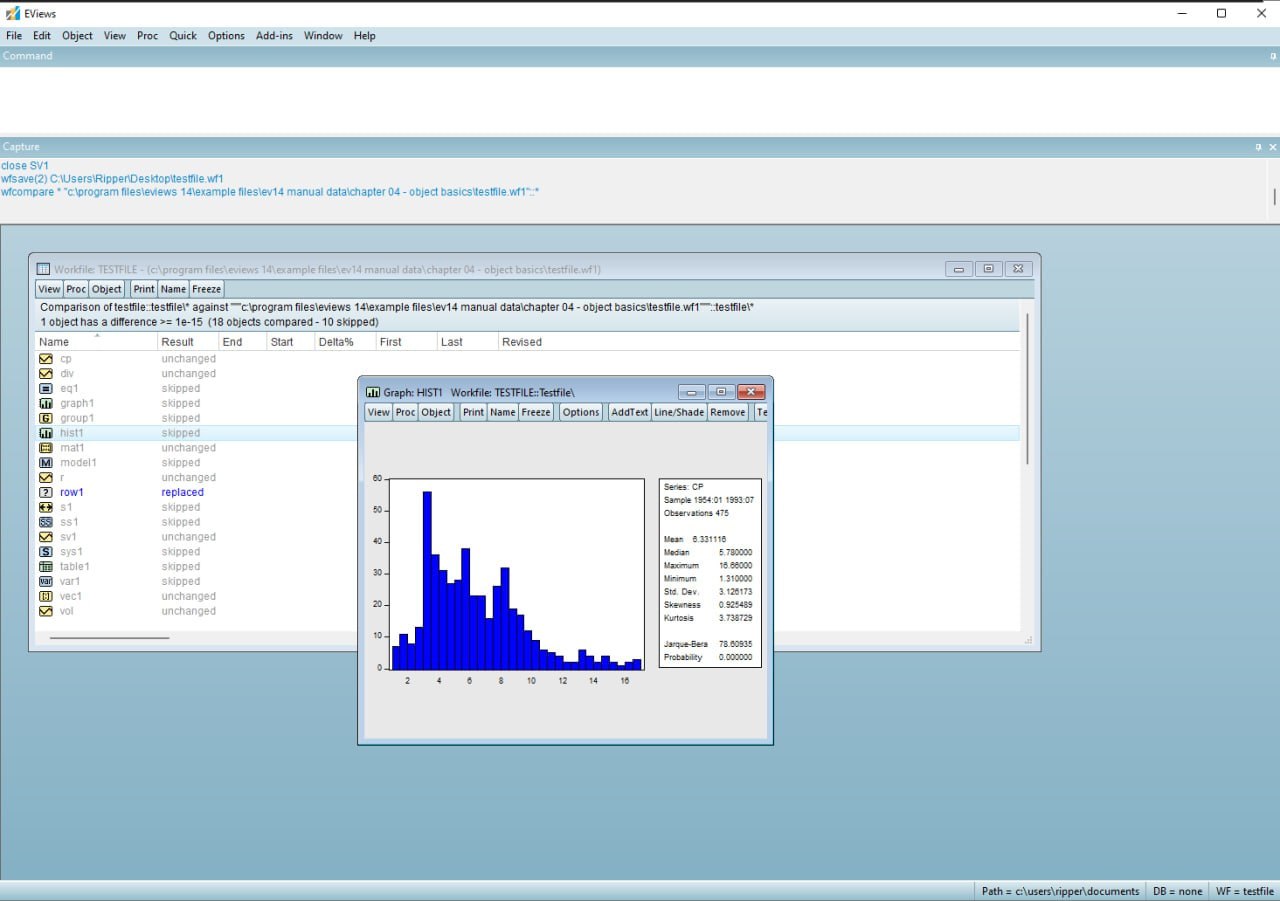
Graphical Visualization and Output Presentation
It also includes powerful visualization tools that help users interpret results and communicate findings effectively. Visual features allow for the creation of high-quality graphs and charts such as line graphs, scatter plots, histograms, and box plots, which can be customized and exported for publication or presentation. These graphical outputs are essential in academic publishing, business reporting, and professional presentations, offering intuitive visual insight into statistical results. It ensures that the visual representation aligns with the analytical results for comprehensive reporting.
Programming and Automation Features
Although it is known for its intuitive user interface, it also supports robust programming and automation features for advanced workflows. Users can write scripts in the EViews command language to automate repetitive tasks, create custom routines, or document analysis processes for reproducibility. It supports batch processing and looping structures, enabling efficient handling of large projects. Moreover, the software provides integration with external environments through COM automation, which allows interaction with tools like MATLAB, R, and Python. This blend of GUI and programming support caters to both casual users and advanced analysts.
Integration with External Data Sources
To support data-driven research, it allows users to connect with external data sources directly, including databases and online platforms. It can access data using ODBC connections and import third-party time series from providers like Datastream, Moody’s Economy.com, and CEIC. This capability simplifies data acquisition and ensures that analysts can work with up-to-date datasets without manual file handling. Working with external data sources directly enhances the flexibility and power of its use in professional research environments where data volume and timeliness are critical.
Editions & Pricing
- EViews Student Version Lite: Free to download for students to complete coursework. It restricts saving and caps data observations, and requires periodic internet access.
- EViews University Edition: An affordable, full-feature subscription for faculty and students that requires an active internet connection to launch.
- Standard & Academic Versions: Full single-user and volume licenses are available for purchase directly from IHS Markit.
Version Evolution and Platform Updates
Since its first release in 1994 as a successor to MicroTSP, it has continuously evolved to incorporate modern techniques and user demands. The latest release, the latest version of this software, includes enhancements in performance, big data handling, and additional statistical tools that cater to both traditional econometrics and contemporary data challenges. Its evolution reflects a commitment to staying relevant in a rapidly changing analytical landscape, providing users with new methods for dynamic modeling, hypothesis testing, and high-performance data analysis.
Use in Academia, Government, and Industry
It is widely used across a variety of sectors, including academic research, government policy analysis, and corporate strategy development. Universities often employ it in econometrics, statistics, and business courses to teach students how to conduct rigorous data analysis. Government agencies use the software for macroeconomic forecasting, policy evaluation, and fiscal planning. In finance and private industry, analysts rely on EViews for market trend analysis, risk assessment, and quantitative modeling that supports strategic decision-making. Its broad applicability and user base make it a staple in professional quantitative work.
Role in Global Data Analysis and Decision Making
In an increasingly data-driven world, tools like it play a central role in transforming raw data into actionable insights. By combining powerful statistical mechanics, econometric modeling, and forecasting capabilities with user-friendly interfaces and automation, it supports evidence-based decision-making across disciplines. Whether it is analyzing economic growth patterns, forecasting financial indicators, or evaluating policy impacts, the software provides a robust platform for rigorous analysis. Its comprehensive feature set helps researchers and professionals draw meaningful conclusions that can drive strategic actions in complex environments.
System Requirements
- OS: 64-bit physical device running Windows or Mac (not supported on virtual machines or 32-bit systems).
- Requirements: Requires
.NET 4.0for certain external database and Excel add-in connectivity.
- Memory/Storage: 512 MB memory and 400 MB of free disk space.