ScopeDSP: Best FFT Spectral Analysis Software Signal Processing Engineers 2026
by Ali Haider · May 18, 2026
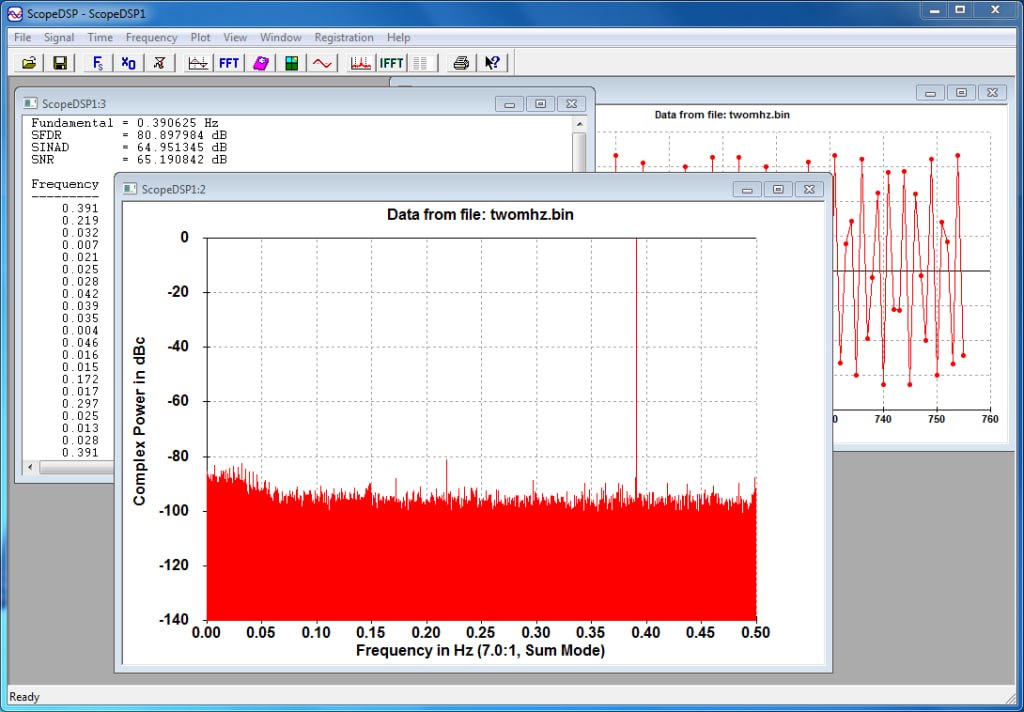
Table of Contents
ToggleSummary
ScopeDSP is a specialized Windows software application by Iowegian International designed for sampled-data signal time and frequency analysis. If you are new to digital signal processing, you will quickly discover that performing FFT (Fast Fourier Transform) analysis and calculating signal statistics like SNR, SINAD, and SFDR can be complex and time-consuming when done manually or with general-purpose tools.
ScopeDSP solves this problem by providing an intuitive graphical interface for time-frequency analysis. It features an Arbitrary-N FFT algorithm that lets you perform FFTs on any length whose prime factors are less than 2000, not just powers of two. For a beginner, this means you are not restricted to standard FFT sizes like 1024 or 2048 samples.
First Impression
When you first install and launch ScopeDSP, the experience is surprisingly approachable for a professional DSP tool. The installer runs quickly. Once launched, you are presented with a clean interface organized around time-domain and frequency-domain plots.
The first thing you notice is the flexibility. You can generate test signals, read existing data files (including WAV files), or import raw binary data. The Arbitrary-N FFT capability means you are not forced to use powers of two; an FFT of 1000 samples or 5000 samples is just as easy as 1024 or 2048.
What makes a strong first impression is the immediate feedback. Load a WAV file, click the FFT button, and within seconds you see the frequency spectrum. The software automatically calculates key statistics: SNR (Signal-to-Noise Ratio), SINAD (Signal-to-Noise-And-Distortion ratio), and SFDR (Spurious-Free Dynamic Range). No complex setup, no scripting, no command-line arguments.
Main Editing Workspace
ScopeDSP organizes its workspace around plots and data displays. The primary view shows time-domain and frequency-domain graphs. You can customize the layout to show both domains simultaneously or focus on one.
- The Time Plot displays your signal amplitude over time. You can zoom, pan, and select regions for detailed analysis. The software supports both real and complex data.
- The Frequency Plot displays the FFT magnitude spectrum. You can view linear or logarithmic scales, convert to dB, and display phase information. The Frequency List, sorted by magnitude, shows detailed information for each major frequency component essential for identifying spurious signals and harmonics.
- The Data Statistics panel automatically calculates time-domain statistics (minimum, maximum, mean, RMS) and frequency-domain statistics (SNR, SINAD, SFDR). These values update as you change window types, scaling, or data selections.
- The Operations list lets you build processing pipelines. You can apply windowing (Blackman-Harris, Kaiser-Bessel, Hamming, Hanning, Gaussian), scaling, zero-padding, and filtering in a selectable sequence. This is valuable for beginners because you can experiment with different processing orders without writing code.
Important Settings
- Window Type: It controls how the FFT handles discontinuities at the edges of your data segment. The default is often Hamming or Hanning. For beginners, experiment with different windows and watch how the frequency plot changes. Blackman-Harris provides better side lobe suppression but wider main lobes. Kaiser-Bessel offers adjustable trade-offs.
- Scaling: It affects the amplitude representation in the frequency domain. dBFS (decibels relative to full scale) is standard for A/D converter measurements. Linear scaling is useful for comparing component amplitudes.
- Zero-Padding: It adds zeros to the end of your data before FFT. This increases frequency resolution (more points in the spectrum) but does not add actual information. For beginners, zero-padding makes peaks easier to identify visually.
- Data Format: It matters when importing or exporting files. It reads and writes many text and binary formats used by common DSP tools. It even supports WAV files. This makes ScopeDSP a very flexible data file converter.
Daily Usage Experience
In daily practice, it becomes an essential tool for signal analysis. A typical day might involve these tasks:
1. Evaluating A/D Converter Performance
An engineer captures samples from a new A/D converter into a file. They load the file into ScopeDSP, apply a window (to reduce spectral leakage), perform the FFT, and immediately see SNR, SINAD, and SFDR. Without ScopeDSP, they would need to write a MATLAB script or Python program. Total time: under two minutes.
2. Generating Test Signals
A DSP engineer needs a modulated waveform to test a new algorithm. They use ScopeDSP’s signal generator to create sine waves, modulated waveforms, or multi-tone signals. They export the data to a text file for use in their simulation.
3. Converting Between Data Formats
A team receives binary data from an acquisition system but needs text format for analysis in another tool. It reads the binary file, displays the time-domain signal (verifying it loaded correctly), and exports to text format. This saves hours of writing custom conversion scripts.
4. Measuring Spurious Components
A communications engineer needs to identify harmonics and spurious signals in a transmitter output. They load the captured data, perform the FFT, and use the Frequency List (sorted by magnitude) to quickly find the strongest components.
Performance During Projects
It is lightweight and responsive. The software launches in seconds. FFT calculations for typical data lengths (up to a few million samples) complete in under one second. The Arbitrary-N FFT algorithm handles any length whose prime factors are less than 2000, so you are not limited to powers of two.
Small Projects (under 100,000 samples): Performance is instantaneous. FFTs complete in under 100 milliseconds. Window and scaling operations update the display immediately.
Medium Projects (100,000 to 1 million samples): The software remains responsive. FFTs take 200-500 milliseconds. Zoom and pan operations are smooth.
Large Projects (over 1 million samples): FFTs may take 1-2 seconds. The software handles the data, but navigation may have slight delays. Consider decimating or windowing large datasets before processing.
Stability is excellent. The software has been used by professionals for years and does not crash during normal operation. The 30-day free trial allows thorough testing before purchase.
Helpful Tips
- Use Window Functions to reduce spectral leakage. If you are analyzing a sine wave and see a broad base around the peak instead of a sharp line, you are seeing spectral leakage. Apply a Hamming or Hanning window before FFT to reduce this effect.
- Verify Your Data First using the time plot before performing FFT. Check that the signal looks correct, there is no clipping (flat tops), and the amplitude is reasonable. This simple step catches many data acquisition problems.
- Use the Frequency List to find spurious signals. The list sorts components by magnitude, making it easy to identify harmonics and spurs that might be missed on the plot.
- Save Project Files to preserve context. Its project files store sampling rate, time/frequency units, decibel reference, and processing settings. This ensures you can reproduce your analysis later.
- Use Zero-Padding for Visual Resolution. If two frequency peaks are close together and appear as one, zero-pad the data (add zeros) before FFT. This increases the number of frequency points and makes the peaks distinguishable.
- Learn One Window First. Start with Hamming window for most applications. Once comfortable, experiment with Kaiser-Bessel for adjustable side lobe suppression.
Better Alternatives
| Tool | Key Features | Pricing | Best For |
|---|---|---|---|
| ScopeDSP | Arbitrary-N FFT, SNR/SINAD/SFDR, WAV support, data conversion | (partofScopeDSPSuite(partofScopeDSPSuite699) | Quick A/D measurements, data conversion |
| MATLAB | Full DSP toolbox, scripting | $$$ (subscription) | Complex algorithm development |
| Python with SciPy | Free, powerful, scripting | Free | Developers comfortable with coding |
| Octave | Free, MATLAB-like | Free | MATLAB users without budget |
| Audacity | Free audio editing, basic FFT | Free | Audio enthusiasts, basic spectrum view |
| PulseView | Free logic analyzer software | Free | Hardware interfacing |
Why Choose ScopeDSP Over MATLAB or Python? It launches instantly (no 30-60 second wait). No scripting is required. The Arbitrary-N FFT is more flexible than MATLAB’s power-of-two limitation. The built-in SNR, SINAD, and SFDR calculations are automatic. For measuring A/D converter performance, no known tool is faster or easier.
Why Choose ScopeDSP Over Free Tools? Free tools like Audacity show basic frequency spectra but lack professional DSP measurements (SNR, SINAD, SFDR, Frequency List sorted by magnitude). Python requires programming. It provides professional results without coding.
Closing Opinion
ScopeDSP is an excellent entry point for beginners who need to perform FFT spectral analysis without learning MATLAB or Python. The software transforms complex DSP tasks windowing, FFT, statistical calculations into a few mouse clicks.
The Arbitrary-N FFT capability is a standout feature. Being able to analyze exactly 1000 samples (not forced to 1024) means you can work with real-world data lengths without artificial padding. The Frequency List sorted by magnitude is invaluable for identifying spurious signals and harmonics.
Who should buy ScopeDSP? Engineers who regularly measure A/D converter performance. DSP professionals who need quick FFT analysis without scripting. Anyone who receives data in various formats and needs a reliable converter.
Who can use free alternatives? Users who are already proficient in MATLAB or Python. Those who only need basic spectrum visualization (Audacity may suffice).
For any engineer working with sampled-data signals, it provides the speed, flexibility, and professional measurements required to analyze time and frequency data efficiently. The Arbitrary-N FFT alone makes it worth the investment.